We help small and medium-sized businesses visualise, analyse and leverage their data to make informed decisions and gain a competitive advantage.
Data visualisation & reporting is a process for making
data more accessible, understandable, and actionable. By transforming data into visual
representations, it facilitates data-driven decision-making, fosters effective communication, and
empowers individuals and organisations to gain valuable insights from their data.
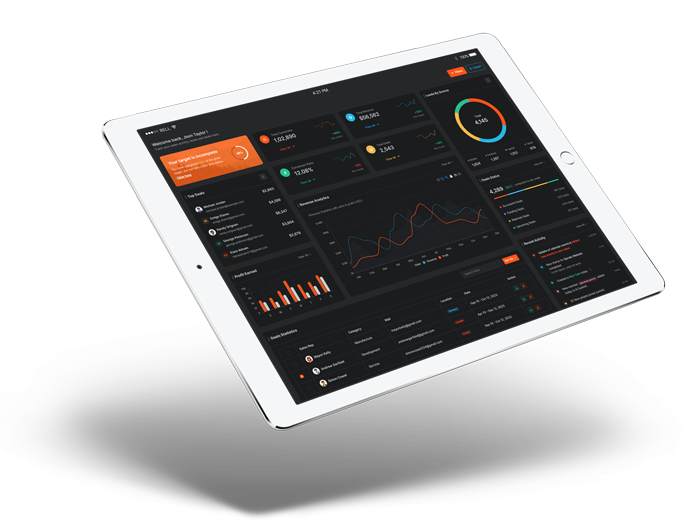
Create dashboards for our clients, we use Microsoft Power BI - one of the best tools on the BI
market, provides a 360-degree view for business users with their most important metrics in one place,
updated in real time, and available on all of their devices.
Gathering relevant data from various sources, including internal systems, external databases, surveys, and market research.
Data visualisation is the visual representation of data through charts, graphs, and other visual elements, enabling easier understanding, analysis, and communication of complex information.
Examining and processing the collected data to identify meaningful patterns, correlations, and trends.
Extracting valuable insights from the analyzed data, which can provide a deeper understanding of the current situation, customer behavior, market trends, or operational performance.
Utilising the insights gained from data analysis to inform and guide the decision-making process. This involves considering the potential impact of different options and selecting the most viable course of action.
Continuously tracking the outcomes and impact of the decisions made, using key performance indicators (KPIs) and other metrics. This helps in assessing the effectiveness of the decisions and making adjustments if necessary.
Data Visualisation
Create interactive and visually appealing dashboards and reports to present your data in a compelling way. It enables you to transform raw data into meaningful visualisations like charts, graphs, maps, and tables, making it easier to understand and analyse information.
Data Integration
Can connect to various data sources, including databases, spreadsheets, cloud services, and online platforms. It enables you to integrate and consolidate data from multiple sources into a single view, providing a comprehensive picture of your business.
Data Analysis
Can perform advanced data analysis and gain insights into your business operations. It offers features such as filtering, sorting, slicing, and drill-down options to explore data from different angles and uncover trends, patterns, and correlations.
Collaboration and Sharing
Power BI enables you to collaborate with team members and stakeholders by sharing dashboards, reports, and datasets. You can set up permissions and access controls to ensure the right people have the appropriate level of access to your data.
Loading Contact Form.
Please wait ...